
Summarize the Content of the Blog





Why ITSI alert noise gets out of hand
Splunk IT Service Intelligence is built around services, KPIs, and notable events. Every KPI threshold breach can produce a notable event. Every external monitoring tool routed into ITSI adds more. A typical mid-size ITSI deployment with 50 services, 200 KPIs, and three external monitoring integrations can generate 5,000 to 30,000 raw notable events per day inside the first 90 days of operation.
The SANS 2025 SOC Survey reported that 66 percent of IT operations teams cannot keep pace with their inbound alert volume. ITSI environments specifically struggle because alert volume scales with service count and KPI granularity, both of which tend to grow over time as teams add more services to monitor.
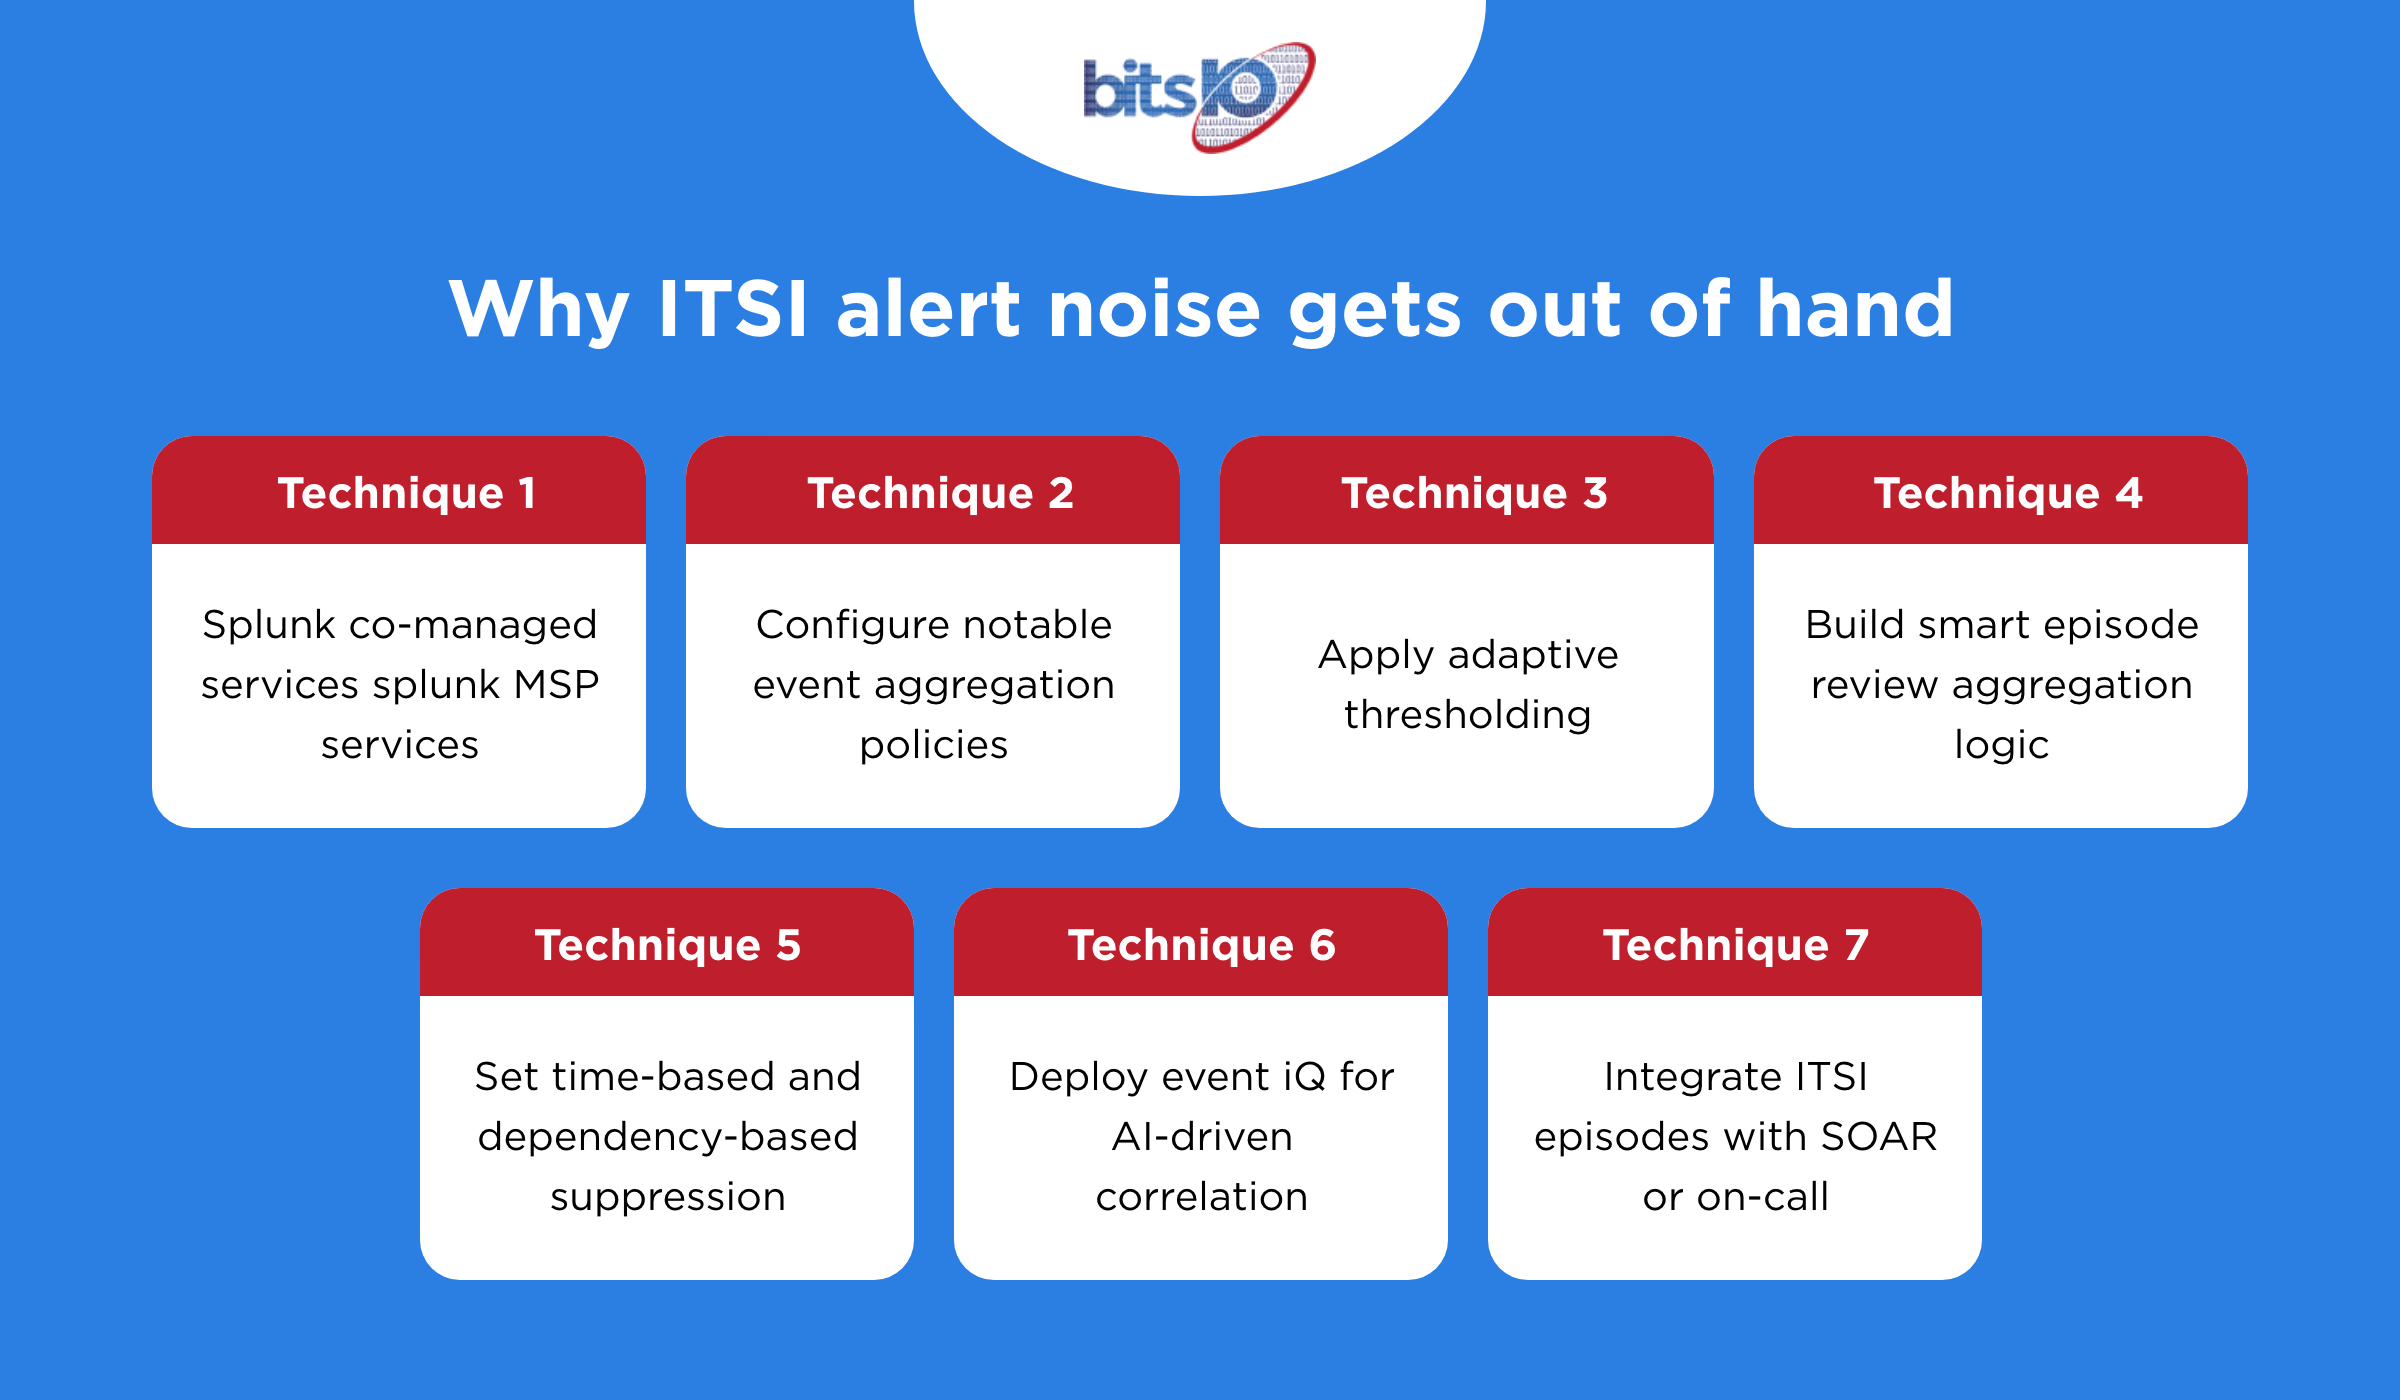
The fix is not single-control. Tuning ITSI alert noise requires layered controls applied in sequence. The seven techniques below are the same sequence a bitsIO consultant runs during a standard ITSI tune-up engagement. For broader context, see how Splunk ITSI transforms incident management.
Technique 1: Tune correlation searches at the source
Most ITSI alert noise originates from correlation searches firing too frequently or against poorly calibrated thresholds. Before any aggregation layer can help, the raw signal must be reasonable.
The audit pattern is the same as ES tuning: pull the top 20 highest-firing correlation searches over a two-week window, calculate true-positive rate per search, and either disable, retune, or accept each one. Searches firing 500 events per day with a 1 percent true-positive rate are tuning candidates. Searches firing 5 times per day with a 90 percent true-positive rate are working correctly.
This step is foundational. Aggregation policies that group bad alerts into episodes just produce bad episodes. Source-level tuning has to happen first.
Technique 2: Configure Notable Event Aggregation Policies
This is the highest-impact ITSI-specific control. Notable Event Aggregation Policies (NEAPs) group related notable events into episodes. One episode replaces many individual alerts.
NEAPs are configured by grouping criteria (host, service, KPI, time window, custom field). A well-designed NEAP for a service outage might group all notable events on the same host within a 15-minute window into a single episode. The Splunk Lantern documentation confirms that well-configured NEAPs reduce raw alert volume by 50 to 90 percent without losing context.
The common configuration mistakes are: grouping windows that are too narrow (events arrive 16 minutes apart and create two episodes for what is clearly one incident), grouping criteria that are too broad (an episode contains 200 unrelated events from across the environment), and missing episode lifecycle rules (episodes never close, so they accumulate forever).
A practical NEAP design starts with three to five named policies aligned to the environment’s primary failure modes: infrastructure outage, application slowdown, security incident, scheduled change window, and unclassified. Each policy gets distinct grouping logic. New event categories can be added later.
Technique 3: Apply adaptive thresholding
Static KPI thresholds are the second-largest source of ITSI noise. A KPI threshold set at “alert when CPU utilization exceeds 80 percent” fires every workday morning at 9 AM and every batch-job window at 2 AM, with no underlying problem.
Adaptive thresholding uses Splunk’s machine learning to set KPI thresholds against the historical distribution of the metric. The threshold becomes “alert when CPU utilization is unusual for this host, at this hour, on this day of the week.” The static-threshold morning spike no longer fires. A genuine anomalous spike on a Sunday at 2 AM still does.
Adaptive thresholding is appropriate for KPIs with cyclical patterns (load, traffic, transaction volume). It is not appropriate for KPIs with hard operational floors or ceilings (free disk space below 5 percent, error rate above 0.5 percent). For those KPIs, static thresholds remain correct.
Technique 4: Build smart Episode Review aggregation logic
Episode Review is the analyst-facing surface in ITSI. After NEAPs group events into episodes, Episode Review is where SRE and NOC teams act on them. The aggregation logic inside Episode Review determines what reaches a human and what gets handled automatically.
Three aggregation rules cover most environments: severity-based escalation (high and critical episodes get human attention immediately, medium episodes queue for batch review, low episodes auto-close after 24 hours if no escalation), entity-based routing (episodes affecting top-tier services route to senior on-call, episodes affecting lower-tier services route to junior queues), and time-based suppression (episodes that occur during a documented change window auto-tag and route to the change-control queue, not the incident queue).
Each of these rules removes a category of episode from the human-attention queue while preserving the audit trail. For dashboard design that supports this analyst workflow, see executive-ready glass tables for Splunk ITSI (forthcoming in this series).
Technique 5: Set time-based and dependency-based suppression
Two suppression patterns address the bulk of remaining noise.
Time-based suppression silences known noisy windows. Scheduled maintenance, monthly batch processing, weekly backup windows. These windows produce expected anomalies. Configure ITSI to either suppress alerts during these windows or auto-tag them with a “change window” label that routes them away from the main incident queue.
Dependency-based suppression silences downstream alerts when an upstream service is known-down. If an authentication service is offline, every downstream application reports authentication failures. Without dependency suppression, ITSI generates an episode per downstream application. With dependency suppression, the authentication service episode is the single incident, and downstream symptoms are linked to it rather than fired as independent episodes.
Dependency suppression requires a populated service dependency graph in ITSI. Most environments under-invest in service dependency mapping. The payoff is direct: a single upstream incident no longer produces 30 downstream episodes.
Technique 6: Deploy Event iQ for AI-driven correlation
Event iQ is Splunk’s AI-driven event correlation feature in ITSI, released in 2025. The Splunk documentation describes it as a system that “learns from your actual data, finding patterns and ranking fields by importance,” then proposes correlations the human did not configure.
In practice, Event iQ is best deployed after the manual NEAP and Episode Review work is done. Its value increases when the underlying signal quality is already reasonable. Deploying Event iQ on top of a fully untuned environment produces AI-augmented noise, not AI-reduced noise.
For environments where Event iQ is appropriate, the gain is the discovery of correlation patterns the operations team did not know existed: cross-service incidents that always co-occur, KPI behavior changes that consistently precede an outage by 20 minutes, alert patterns that turn out to be one root cause. For deeper context on the AI layer, see Splunk’s 2025 AI/ML enhancements.
Technique 7: Integrate ITSI episodes with SOAR or On-Call
The final layer is the automation surface. ITSI episodes that survive the previous six controls are real incidents that need a response. Integrating ITSI with Splunk SOAR or Splunk On-Call automates the response motion.
Common integration patterns include: high-severity episodes auto-trigger a SOAR playbook (enrichment, ticket creation, paging the on-call engineer), medium-severity episodes create a ServiceNow ticket and notify the team Slack channel, recurring episodes (same entity, same KPI, third firing in 24 hours) escalate to a senior engineer for root-cause investigation.
A well-integrated ITSI-SOAR-On-Call stack converts a 5,000-events-per-day baseline into a 50-incidents-per-day human queue, with the rest handled automatically through enrichment, triage, and routing. The SOC and NOC teams shift from triage to investigation. The IT operations workload becomes manageable.
For broader context on how SOAR fits this pipeline, see the five SOAR playbook patterns that cut MTTR (forthcoming in this series).