


As a 4x Splunk Partner of the Year, bitsIO brings comprehensive expertise in designing, implementing, and optimizing Splunk Observability Cloud deployments. Our proven methodology ensures immediate visibility improvements while establishing a strong foundation for long-term application performance excellence.


Tailored deployments that optimize performance while accommodating your specific infrastructure requirements across public cloud, private cloud, and hybrid environments.

Comprehensive monitoring of modern microservices applications with specialized configuration for Kubernetes, Docker, and container orchestration platforms.

Unified visibility across distributed computing environments with specialized deployment expertise for edge computing and multi-cloud architectures.


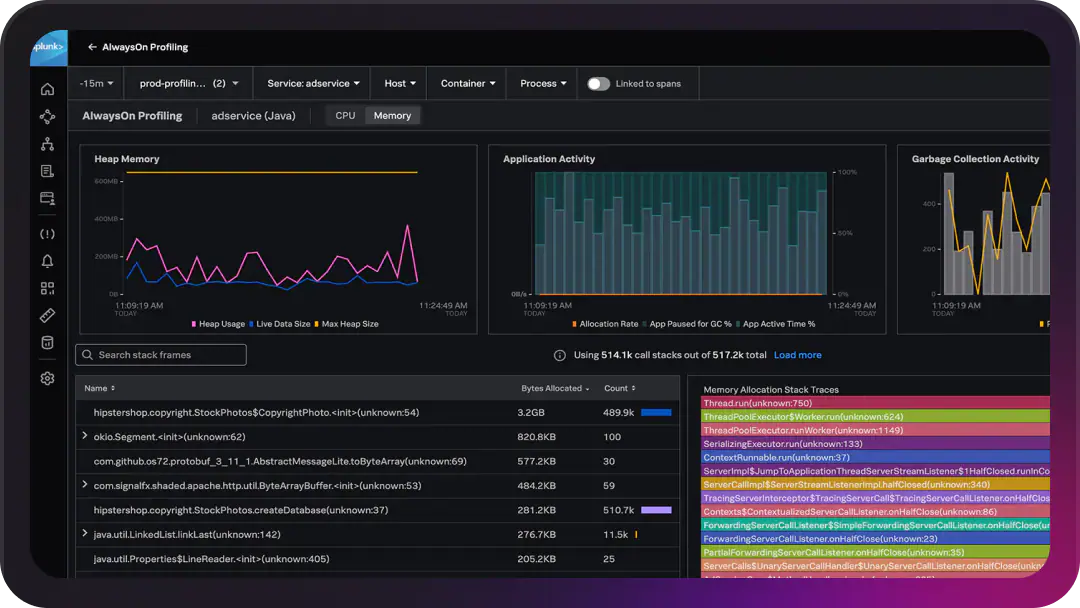
Splunk Observability Cloud is a full-stack observability platform that correlates metrics, logs, and traces in one interface. It provides infrastructure monitoring, APM, log observer, real user monitoring, synthetic monitoring, and incident response capabilities for modern distributed systems.
Traditional monitoring tools usually look at one signal type, such as metrics or logs, in isolation. Splunk Observability Cloud connects metrics, logs, and traces with shared context, captures 100% of trace data with NoSample tracing, and uses OpenTelemetry-native instrumentation to avoid vendor lock-in.
Yes. Splunk Observability Cloud uses OpenTelemetry as its native instrumentation standard, so teams can instrument applications once and route data to Splunk or other backends without rewriting agents.
bitsIO designs the observability architecture, instruments applications and services, integrates with existing monitoring and ITSM tools, tunes performance, and connects observability data with business context. The team also provides ongoing optimization.
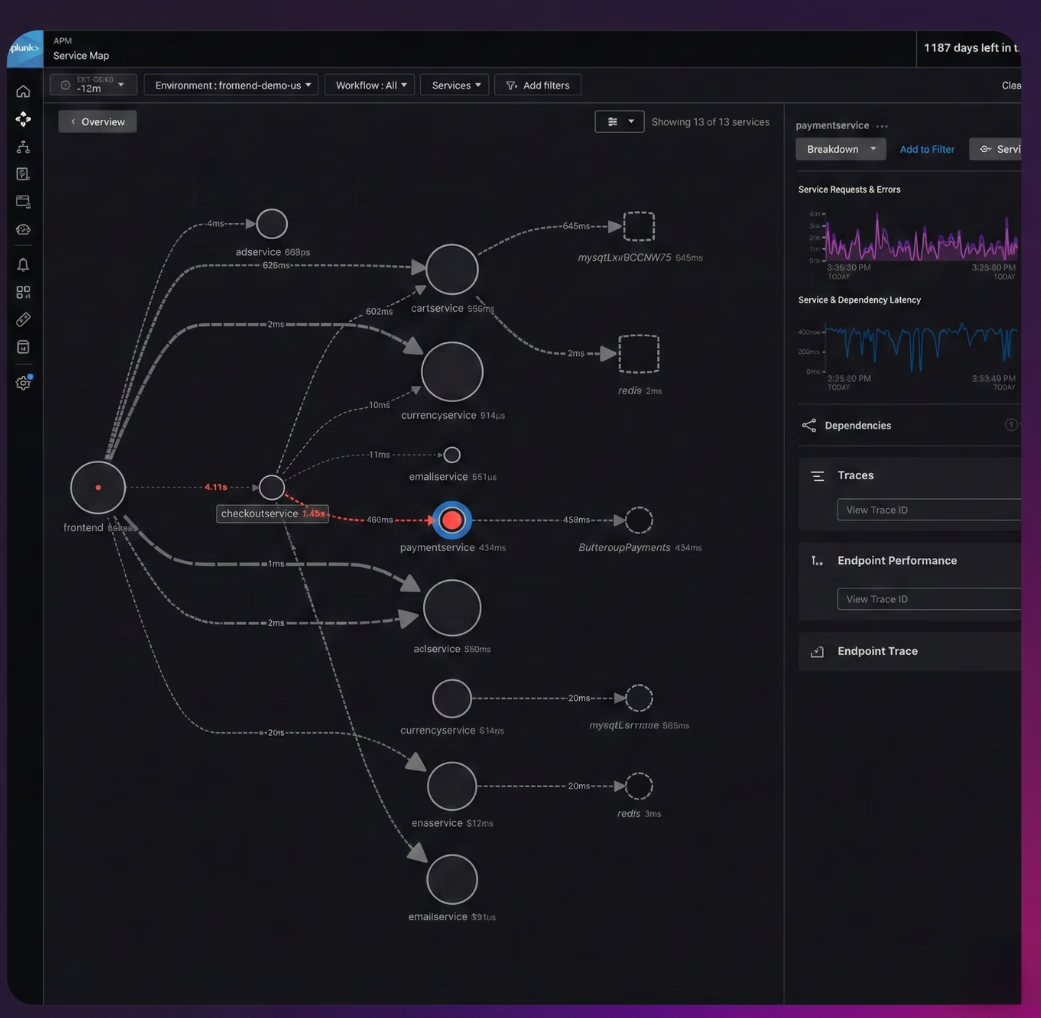
Yes. It is designed for distributed, microservices-based, and Kubernetes environments, with built-in service maps, trace analytics, and real-time alerting that handle high cardinality and dynamic infrastructure well.
By correlating metrics, logs, and traces in one place and surfacing related telemetry around an incident, Splunk Observability Cloud removes the manual stitching analysts usually do across tools. AI-driven service maps and trace analytics shorten root cause analysis.
Yes. Observability Cloud integrates with Splunk ITSI to map application performance data to business services, so observability findings tie back to service health and business impact rather than living as standalone application metrics.
NoSample tracing captures and analyzes 100% of trace data rather than sampling a subset like many APM tools. This matters when a problem only affects a small portion of users or requests, because sampling can hide rare but high-impact issues from view.
Yes. Splunk Observability Cloud monitors workloads across AWS, Azure, GCP, and on-premises environments, with native integrations for major cloud services. It is designed for multi-cloud and hybrid deployments rather than a single cloud provider.
Splunk APM focuses on application performance through traces and service maps. Splunk Log Observer focuses on log analysis with no-code filtering and pipeline tools. Both sit inside Splunk Observability Cloud and share context, so engineers can pivot between traces, logs, and metrics in one workflow.

We're a team of passionate experts helping businesses like yours extract maximum value from their data investments. Whether you need to streamline data pipelines, build AI-powered solutions, or unlock advanced analytics, we have the expertise to guide you through every step.


920 South Spring St, Ste 1200, Springfield, IL, 62704




Copyright © 2026 bitsIO | All Rights Reserved.