Summarize the Content of the Blog


Key Takeaways
Splunk Observability Cloud has been recognized as a Leader in the 2025 Gartner® Magic Quadrant™ for Observability Platforms for three consecutive years, and is the only vendor named a Leader in both SIEM and Observability
OpenTelemetry-native architecture enables organizations to instrument once using open standards while maintaining full control over telemetry data
NoSample™ tracing provides 100% data visibility, eliminating blind spots that sampling creates
AI-powered analytics, business-context integration, and unified telemetry position Splunk ahead of 2026 observability trends
bitsIO, as a 4x Splunk Partner of the Year, brings proven expertise to accelerate Splunk Observability Cloud implementations
Introduction: The Observability Imperative in 2026
Digital transformation has fundamentally reshaped business operations. Modern enterprises run on complex, distributed systems spanning multi-cloud environments, microservices architectures, and AI-powered applications. Traditional monitoring—designed for simpler, monolithic systems—cannot keep pace.
As we enter 2026, the question isn’t whether your organization needs observability, but whether you have the right observability solution. Splunk’s State of Observability 2025 report reveals that observability insights are now guiding critical business decisions around customer experience, product innovation, and AI adoption.
For IT decision-makers and C-suite executives evaluating cloud observability platforms, Splunk Observability Cloud has emerged as the go-to solution—backed by consistent industry recognition, innovative technology, and proven results.
Understanding Modern Observability: Beyond Traditional Monitoring
Monitoring tells you what is wrong — for example, a service is down or response times are slow. It is largely reactive, based on predefined metrics, thresholds, and known failure modes.
Observability helps you understand why something is happening, even when unexpected. It provides the ability to ask arbitrary questions about your system’s internal state by examining telemetry: metrics, logs, and traces.
According to Splunk, observability empowers organizations to:
- Detect and resolve incidents faster with real-time telemetry, reducing Mean Time to Detect (MTTD)
- Pinpoint root causes across distributed systems through end-to-end tracing
- Strengthen system reliability by proactively addressing issues before SLA violations
- Transform telemetry into business insights connecting technical performance to customer experience and revenue
The Observability Landscape in 2026: Key Trends
Several critical trends are shaping observability in 2026:
1. OpenTelemetry Standardization
OpenTelemetry is becoming the universal language of telemetry, with experts predicting ~95% adoption for new cloud-native instrumentation by 2026. This standardization reduces integration complexity and prevents vendor lock-in.
2. AI Observability and AIOps Evolution
Organizations are deploying more AI/ML applications, including large language models and agentic AI systems. According to industry predictions, agentic AI introduces exponential system complexity, requiring observability platforms capable of monitoring AI model performance, accuracy, cost, and security alongside traditional infrastructure.
3. Unified Full-Stack Observability
Siloed tools create operational friction. The trend toward unified observability platforms that correlate metrics, logs, traces, and business context is accelerating.
4. Business-Context Integration
Technical metrics divorced from business impact lead to misaligned priorities. Modern observability tools must connect system telemetry to actual business outcomes—revenue, customer satisfaction, conversion rates.
5. Cloud-Native Maturity
As Kubernetes adoption matures, observability solutions must provide native support for containerized environments, service meshes, and dynamic infrastructure.
Why Splunk Observability Cloud Leads in 2026
Industry Recognition: Three-Year Leadership
Splunk has been named a Leader in the 2025 Gartner® Magic Quadrant™ for Observability Platforms for the third consecutive year. Notably, Splunk was the only vendor named a Leader in both SIEM and Observability for the Gartner Magic Quadrant three times, demonstrating comprehensive platform strength.
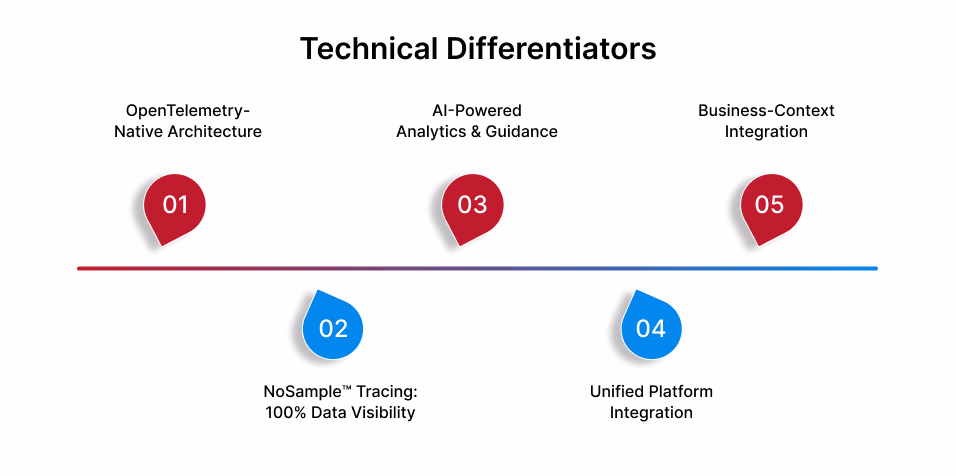
Technical Differentiators
1. OpenTelemetry-Native Architecture
Splunk Observability Cloud is OpenTelemetry-native, providing:
- Vendor neutrality: Instrument applications once using open standards
- Future-proofing: Positioned for the OTel ecosystem as it becomes industry standard
- Data ownership: Control your telemetry pipeline without proprietary lock-in
2. NoSample™ Tracing: 100% Data Visibility
While competitors rely on sampling—capturing only 1-10% of traces—Splunk’s NoSample™ tracing collects and analyzes 100% of trace data. This provides:
- No blind spots: Intermittent or rare issues become visible instead of disappearing into sampling gaps
- Complete transaction visibility: Every customer transaction is traced end-to-end
- Accurate analytics: Analysis on complete data produces facts, not statistical estimates
3. AI-Powered Analytics and Guidance
Splunk leverages AI/ML-driven features like Service Maps and Trace Analytics providing:
- Automated anomaly detection with adaptive thresholding
- Automatic service dependency mapping
- Root cause analysis acceleration
- Alert storm management grouping related alerts into unified incidents
4. Unified Platform Integration
Splunk Observability Cloud automatically correlates petabyte-scale log analytics with real-time metrics and traces, enabling:
- Seamless log correlation in context when investigating performance issues
- Single-pane-of-glass visibility without context-switching
- Historical depth leveraging years of log data alongside real-time observability
5. Business-Context Integration
Splunk enables teams to integrate business context, workflows, and tags with telemetry data, allowing:
- Mature Service Level Objective (SLO) management
- Customer journey mapping visualizing how technical issues impact end-user experiences
- Business KPI correlation connecting technical metrics to revenue and customer satisfaction
Latest Innovations (November 2025)
Recent enhancements include:
- Enhanced AI Infrastructure Monitoring: Dashboard support for Cisco AI Pods, Nvidia NIMs, vector databases (Milvus, Pinecone), LiteLLM proxy services, GCP VertexAI, and LangChain LLMs
- Usage Analytics: Capabilities to analyze dimensions and metrics, optimizing telemetry data volume
- APM-Database Monitoring Correlation: Links application performance to specific database queries
- Service Instance Infrastructure Correlation: Correlates service instances with Kubernetes pod IDs and infrastructure data
Splunk vs. Competitors: Strategic Comparison
Several factors differentiate Splunk from competitors like Datadog, Dynatrace, and New Relic:
Integration with Security and IT Operations
Splunk’s unique position as a leader in both SIEM and Observability creates synergies competitors cannot match. Organizations using Splunk for security can seamlessly extend into observability.
Enterprise Scale
Splunk’s heritage managing petabyte-scale data provides proven credibility for the largest, most complex enterprise environments
OpenTelemetry Commitment
Splunk’s native OTel architecture—not a bolt-on integration—provides deeper capabilities and future-proofs investments.
NoSample™ vs. Sampling
Splunk’s complete data capture eliminates compromises inherent in sampling-based approaches, providing accuracy and coverage competitors cannot match without significantly higher costs.
Cost Control
Splunk Observability Cloud provides built-in telemetry pipeline capabilities that transform, filter, and route data to optimize volume—helping control costs without punitive overages.
How bitsIO Accelerates Splunk Observability Success
Successful observability implementations require expertise, best practices, and ongoing optimization. As a 4x Splunk Partner of the Year, bitsIO brings comprehensive expertise in designing, implementing, and optimizing Splunk Observability Cloud deployments.
Rapid Time-to-Value
bitsIO’s structured implementation approach delivers immediate visibility improvements while establishing a foundation for long-term observability excellence.
Deployment Flexibility
bitsIO tailors deployments to your infrastructure:
- Cloud-native and hybrid architecture support
- Microservices and container-native observability for Kubernetes and Docker
- Multi-cloud and edge computing support
Best Practices and Governance
bitsIO helps organizations:
- Establish effective SLO and alerting strategies
- Implement telemetry pipeline optimization
- Design custom dashboards aligned to organizational roles
- Integrate business context tags for impact-based prioritization
Ongoing Optimization
bitsIO provides continuous support to:
- Adapt observability practices as applications evolve
- Optimize data ingestion and retention
- Train teams on advanced features
- Improve signal-to-noise ratio and incident response
Conclusion: Positioning for Observability Leadership in 2026
As digital systems grow more complex—driven by cloud-native architectures, AI adoption, and customer expectations—observability has evolved from technical nice-to-have to business imperative. Organizations thriving in 2026 will detect issues faster, understand business impact immediately, and resolve problems before customer impact.
Splunk Observability Cloud’s three-year recognition as a Gartner Leader, combined with its OpenTelemetry-native architecture, NoSample™ tracing, AI-powered analytics, and unified platform capabilities, positions it as the premier solution for enterprise observability. Continuous innovation—particularly around AI observability, business-context integration, and cloud-native support—ensures it will remain at the forefront.
Partnering with implementation experts like bitsIO—who bring proven methodologies, deep Splunk expertise, and successful deployment track records—accelerates time-to-value and ensures observability investments deliver measurable business outcomes.
The future of observability is unified, intelligent, and open. Organizations embracing this vision with Splunk Observability Cloud and expert partners like bitsIO will gain competitive advantages through superior digital reliability, faster innovation, and deeper business insights.
Ready to Transform Your Observability Strategy?
Contact bitsIO today for a consultation on how Splunk Observability Cloud can provide complete visibility across your applications, infrastructure, and business processes. As a 4x Splunk Partner of the Year, bitsIO brings expertise and proven methodology to help you achieve observability excellence in 2026.
Schedule Your Consultation with bitsIO →