Summarize the Content of the Blog


Key Takeaways
Alert fatigue is not a tool problem; it is a configuration and design problem that Splunk ITSI is built to solve.
Splunk ITSI Notable Event Aggregation Policies group related alerts into episodes, cutting raw alert volume by 50–90% without losing context.
Episode Review gives NOC and SRE teams one trusted, unified workspace by replacing fragmented alert dashboards.
Well-tuned correlation searches upstream are as important as the aggregation policies themselves.
Integrating ITSI episodes with Splunk On-Call or SOAR turns volume reduction into fully automated triage.
Most IT teams are not short on alerts. They are short on signal. The SANS 2025 SOC Survey found that 66% of operations teams cannot keep pace with the volume of alerts they receive [1]. The Verizon 2025 Data Breach Investigations Report puts the real cost in plain terms: in 96% of breaches, the attackers disclosed the incident, not the security team [2]. That is not a staffing problem. That is a design problem.
Splunk IT Service Intelligence (ITSI) was purpose-built to address this. Its Event Analytics framework, built around Splunk ITSI notable event aggregation, correlation policies, and the Episode Review dashboard, gives operations teams a structured path from raw alert noise to meaningful, context-rich incidents. But the capability only pays off when it is configured thoughtfully.
This guide walks through how the system works, what best practices actually look like in practice, and how to connect ITSI episodes to automated triage using Splunk On-Call and SOAR.
Why ITSI Alert Fatigue Is Different from General Alert Volume
IT and NOC teams running Splunk face a particular version of this problem. Correlation searches pull from multiple data sources and generate notable events, each one valid in isolation, but meaningless when 400 of them land in a dashboard in 10 minutes during a network flap.
The underlying issue is that traditional alerting is event-centric: one condition fires, one alert surfaces. ITSI's approach is episode-centric: related events are grouped into a single, structured incident with a timeline, severity, and status that evolves as the situation develops. This shift from Splunk ITSI noise reduction through suppression to Splunk ITSI incident correlation through aggregation is what makes the difference between a team that investigates and a team that scrolls.
ITSI Event Analytics is designed to make event storms manageable and actionable. Notable event aggregation policies group the events into meaningful episodes, a group of events occurring as part of a larger sequence. (5)
How Splunk ITSI Event Analytics Actually Works
Understanding the architecture helps you configure it correctly. The flow looks like this:

- Correlation searches run against Splunk indexes and generate notable events, stored in the itsi_tracked_alerts index.
- The ITSI Rules Engine — a continuously running indexed real-time search picks up those notables and applies your ITSI Notable Event Aggregation Policies.
- Matching events are grouped into episodes and written to the itsi_grouped_alerts index. Episode metadata lives in KV store collections.
- The Episode Review dashboard surfaces those episodes with severity, status, owner, and timeline, giving your team one view instead of hundreds.
The latency between itsi_tracked_alerts and itsi_grouped_alerts is worth understanding. If episodes show up late in Episode Review, the most common causes are: the Rules Engine not processing events in the right time order, or correlation search frequency not aligning with time range (producing duplicate notables). Per Splunk documentation, setting search frequency equal to the time range in correlation searches is a foundational best practice for eliminating duplicates [3].
Designing ITSI Notable Event Aggregation Policies That Work
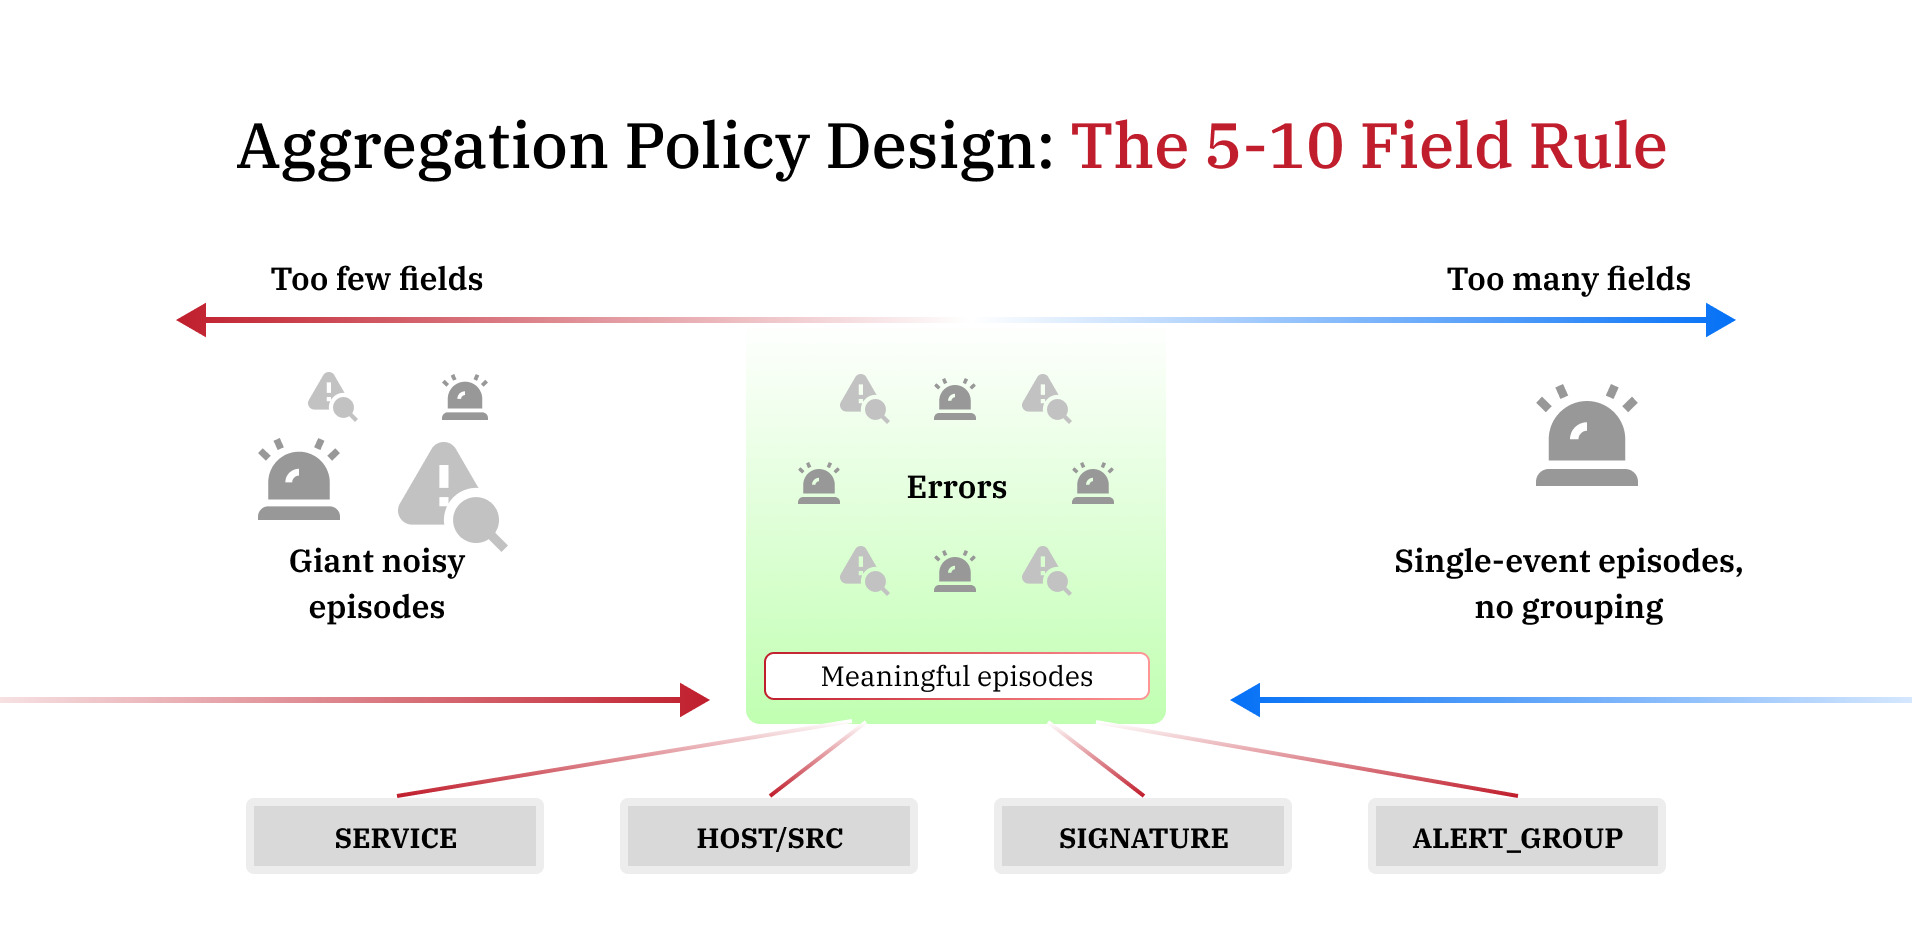
This is where most teams get it wrong, either building one policy that swallows everything into a giant, useless bucket or building 40 policies that recreate the fragmentation they were trying to escape.
Splunk's own documentation gives clear guidance: select between 5 and 10 fields per policy. Fewer than five, and loosely related events, collapse into the same episode. More than ten, and events rarely match all criteria, producing single-event episodes that offer no noise reduction [4].
Splunk also recommends a hard ceiling of 20 time-based aggregation policies and 20 non-time-based policies. Time-based policies are those with breaking criteria or action rules tied to duration, which carry performance overhead on the Rules Engine. Exceeding these limits creates both performance issues and operational silos.
Practical field selection to consider:
- service or serviceid — groups events affecting the same service
- src or host — groups events from the same infrastructure source
- signature — groups events of the same alert type (useful for Universal Alerting sources like Nagios or SolarWinds)
- alert_group — a custom field you populate in correlation searches to link KPIs across related services
Group events based on how they relate to each other — not based on which team handles them. That is the most common mistake: building policies around org structure rather than failure topology.
Splunk's Content Pack for ITSI Monitoring and Alerting includes a set of preconfigured correlation searches and aggregation policies that produce meaningful, actionable alerts out of the box — a useful starting reference before building custom policies.
Making Episode Review Your Team's Primary Incident View
Episode Review is more than a dashboard; it is a workflow engine. Each episode can be classified by impact and urgency, assigned to a team member, escalated, and resolved. When teams trust it as the primary view, they stop toggling between alert feeds.
For that trust to develop, the episodes surfaced in the Episode Review need to be consistent and meaningful. A few practices that help:
- Use dynamic severity in episodes — set episode severity to match the highest severity notable event received, rather than locking it statically at creation. This keeps the episode's urgency current as the situation evolves.
- Configure breaking criteria carefully. Closing an episode breaks it — no new events can be added even if the aggregation policy's criteria are not met. Use time-based breaking (e.g., 12 minutes of quiet after all KPIs clear) rather than manual closure for automated workflows.
- Add action rules in your aggregation policies to auto-comment, auto-assign, or auto-create tickets when episode conditions are met. This reduces the manual triage load on analysts.
For ITSI SOAR automation or Splunk On-Call integration with ITSI episodes, the episode itself, not the individual notable event, becomes the unit that triggers downstream workflows. This means only real, correlated incidents page on-call engineers, not raw event storms.
Tuning Correlation Searches Before They Feed ITSI
Aggregation policies can only do so much if the correlation searches feeding them are generating low-quality notables. A few upstream adjustments with significant downstream impact:
- Set search frequency equal to time range to avoid duplicate notables from overlapping search windows .
- Normalize field names across data sources. The Rules Engine compares fields like signature, src, host, and CI across events; if they are named inconsistently across sources, events that should group together will not.
- Use ITSI's Universal Alerting framework for third-party sources (Nagios, SolarWinds, SCOM). It standardizes field output and simplifies aggregation policy configuration.
- Delete or disable correlation searches tied to services you are no longer monitoring, but do it manually to avoid also disabling the search itself.
For teams exploring machine learning-based alert correlation, ITSI's Event Analytics includes a Smart Mode feature (also called EventiQ) that uses ML to group similar events automatically, a useful complement to manually configured policies when event patterns are inconsistent.
Closing Thought
Reducing alert fatigue in Splunk ITSI is not about suppressing alerts; it is about building the infrastructure for your team to see clearly. The combination of well-designed Splunk ITSI correlation policies, meaningful ITSI notable event aggregation policies, and a trusted Episode Review workflow gives NOC and SRE teams a way to work on real problems rather than sort through noise.
At bitsIO, we help organizations move from default ITSI configurations to tuned, operational environments, including service modeling, aggregation policy design, correlation search optimization, and SOAR integration. If your Episode Review looks like a firehose rather than a triage queue, that is where to start. Schedule a consultation with our experts to know more.
Frequently Asked Questions