Summarize the Content of the Blog


What Splunk ITSI is (and is not)
Splunk IT Service Intelligence (ITSI) is a Splunk premium app for service-oriented monitoring of IT operations. It sits on top of Splunk Enterprise or Splunk Cloud and adds three structural concepts: services (the business-meaningful units being monitored), KPIs (metrics that describe service health), and episodes (groupings of related notable events into actionable incidents).
ITSI is not a replacement for application performance monitoring (APM), infrastructure monitoring (Datadog, New Relic, Dynatrace), or network performance monitoring. It is a service-correlation and alert-aggregation layer that ingests signals from those tools and from Splunk-indexed data, then organizes them around services rather than tools.
The Splunk documentation describes ITSI as the AIOps and Event Intelligence layer of the Splunk portfolio. The Splunk 2025 release introduced Event iQ, an AI-driven correlation feature for ITSI notable events. The platform continues to expand its machine-learning-based features for adaptive thresholding, episode grouping, and predictive analytics.
For broader operational context, see how Splunk ITSI transforms incident management and ITSI best practices for IT operations.
The six phases of a Splunk ITSI implementation
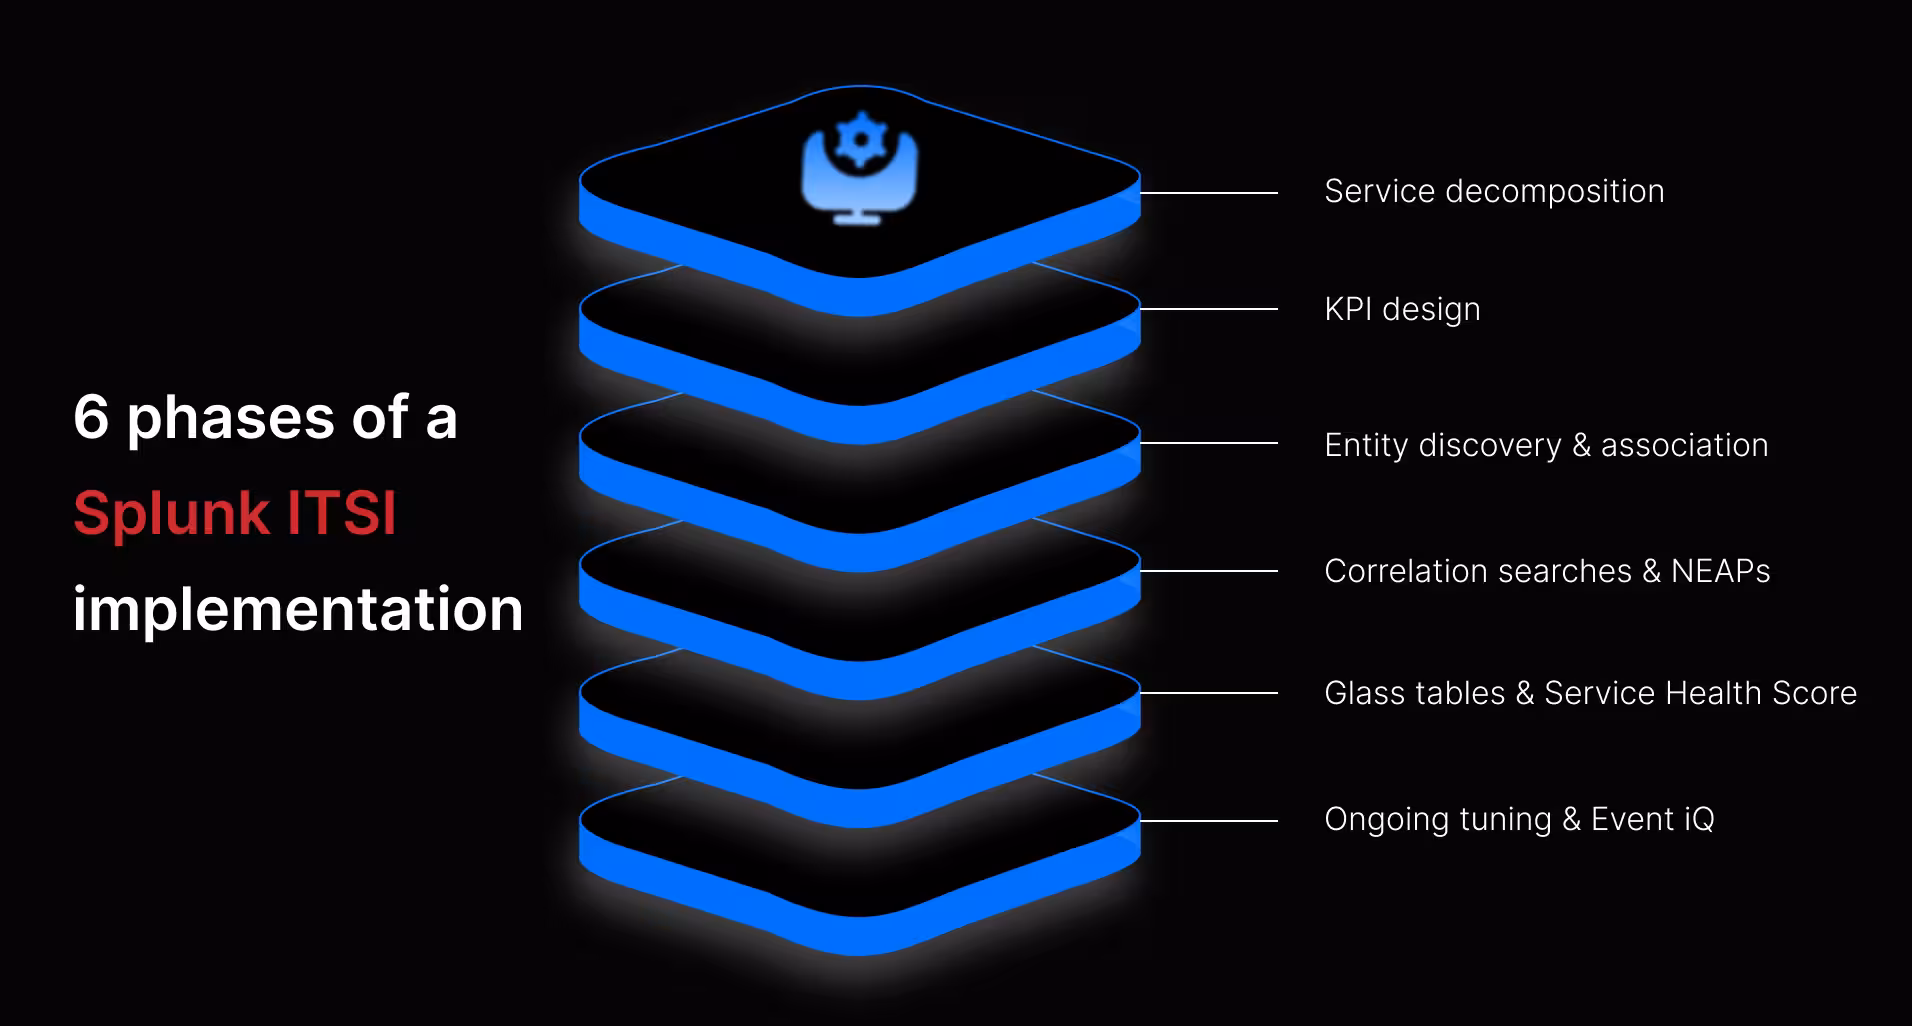
A Splunk ITSI implementation that delivers measurable IT operations outcomes follows the same six phases. The phases overlap in time but the order matters. Skipping or compressing an early phase produces problems that compound in later phases.
A focused mid-size implementation (50 to 150 services, 200 to 800 KPIs) typically runs 12 to 20 weeks end-to-end. Larger deployments or environments with significant external monitoring tool integration usually take 6 to 9 months. The first measurable IT operations outcome (an episode replacing 50+ raw alerts) usually appears within the first 6 weeks.
Phase 1: Service decomposition
Service decomposition is the single highest-leverage decision in an ITSI implementation. Every later phase inherits the structure decided here. Most failed ITSI deployments fail because the service catalog was either too coarse (every problem rolls up to one mega-service) or too fine (every microservice is its own service, producing dashboard sprawl).
The right granularity is service-level. A “service” in ITSI should map to something a business stakeholder cares about. Examples: order processing, customer authentication, payment gateway, email delivery, EHR application uptime in a healthcare context. Each service has identifiable owners, identifiable failure modes, and identifiable business impact when it breaks.
The decomposition is hierarchical. A parent service (“Customer Portal”) rolls up health from child services (“Authentication”, “Profile Management”, “Order History”, “Payments”). Each child service may have its own child services. Three levels of hierarchy is the practical maximum before navigation becomes painful. The Splunk ITSI documentation specifies parent-child relationship modeling explicitly.
Output of Phase 1: a service catalog with named services, parent-child relationships, named service owners, and a one-paragraph description per service of “what this service does and what it means when it breaks.”
Phase 2: KPI design
KPIs are the metrics ITSI tracks per service. Each KPI has a defined data source, a query expression, a calculation period, and threshold logic that determines KPI health (Normal, Low, Medium, High, Critical).
Three KPI categories cover most services: availability KPIs (is the service up, can it accept requests, do requests succeed), performance KPIs (response time, throughput, error rate), and business KPIs (transaction volume, business outcomes that depend on the service). Each service should have a minimum of three KPIs covering each category and a practical maximum of seven to nine KPIs total. Beyond nine KPIs per service, the Service Health Score becomes noisy and operators stop trusting it.
KPI thresholds should be set against actual environmental baselines, not against generic defaults. For cyclical KPIs (load patterns that follow business hours, weekly cycles, monthly batch windows), adaptive thresholding via Splunk’s machine learning is more accurate than static thresholds. For KPIs with hard operational floors or ceilings (free disk below 5 percent, error rate above 0.5 percent), static thresholds remain correct. The seven tuning techniques for ITSI alert noise reduction covers KPI threshold calibration in detail.
Output of Phase 2: a KPI library per service with documented thresholds, calculation methods, and threshold rationale. Every KPI should have a written answer to “why this threshold, why this calculation, why this severity.”
Phase 3: Entity discovery and association
Entities are the infrastructure objects (hosts, virtual machines, containers, network devices, applications) that contribute data to KPIs. Phase 3 inventories the entity landscape and associates each entity with the service(s) it supports.
ITSI auto-discovery features pull entities from Splunk indexed data and external sources (CMDB integrations, cloud provider APIs, Kubernetes cluster APIs). The auto-discovery output is a starting catalog. The Phase 3 work is curating that catalog: deduplicating entities discovered from multiple sources, naming them consistently, associating them with services per the Phase 1 catalog, and managing entity lifecycle (decommissioning entities that no longer exist, onboarding new entities as the environment changes).
For environments with strong CMDB hygiene, Phase 3 is shorter (the CMDB provides the entity ground truth). For environments without strong CMDB hygiene, Phase 3 is the place where the ITSI implementation surfaces and fixes a year or more of inventory drift. The latter case is common.
Output of Phase 3: an entity catalog with named entities, associated services, source-of-truth identification, and lifecycle ownership.
Phase 4: Correlation searches and Notable Event Aggregation Policies
Phase 4 is where signals start becoming actionable. Correlation searches generate notable events from the underlying data. Notable Event Aggregation Policies (NEAPs) group related notable events into episodes.
Correlation search design follows the audit pattern: every correlation search has a documented use case, a calibrated threshold, a defined throttling window, and a documented true-positive rate after the first 30 days of operation. Searches with low true-positive rates are tuned or disabled. The patterns are covered in detail in the seven tuning techniques for ITSI alert noise reduction.
NEAP design follows the principle of “one episode per real incident.” A NEAP for a customer-portal outage groups notable events from all underlying services (authentication, profile management, payments) that fire during the same time window into a single episode. The episode is the unit of operator attention. Splunk Lantern documentation describes the four-step ITSI alert workflow (raw alert preparation, notable event creation, service context application, episode review) that NEAPs implement.
Output of Phase 4: configured correlation searches with documented behavior, configured NEAPs aligned to environmental failure modes, and an episode-creation rate that operators find sustainable.
Phase 5: Glass tables and Service Health Score
Phase 5 is the analyst-facing layer.
Service Health Score is ITSI’s calculated rollup of KPI health into a single 0-to-100 score per service. The calculation considers each KPI’s current state, its weight in the service rollup, and the parent-child relationships in the service catalog. Service Health Score is the single most-watched number in most ITSI deployments. The calculation logic and the weight assignments must be documented and stakeholder-reviewed before the score goes live.
Glass tables are the operational dashboards that present service health, KPI trends, recent episodes, and contextual data to operators. A well-designed glass table has three properties: it answers a specific operational question (not “what is happening” but “is order processing healthy right now”), it shows actionable signals (not vanity metrics), and it scales to the audience it is built for (NOC, SRE, executive). Glass table design is its own discipline; the executive-ready glass table guide covers the design patterns.
Output of Phase 5: deployed Service Health Score per service, glass tables aligned to the operational audience (NOC for incident response, SRE for service tuning, executive for business outcomes), and documentation of the rollup logic.
Phase 6: Ongoing tuning and Event iQ
Phase 6 is continuous, not a stage. A well-implemented ITSI deployment improves monthly through tuning. Without ongoing tuning, the deployment degrades within 6 to 9 months as the environment evolves and the original calibration becomes stale.
The ongoing tuning cadence typically includes: monthly KPI threshold review (which KPIs are firing too often, which not enough), monthly NEAP grouping review (which episodes are coherent, which are noisy), quarterly service catalog review (which services are obsolete, which new services need to be added), and ongoing entity hygiene (decommissioning, onboarding).
Event iQ is Splunk’s AI-driven event correlation feature in ITSI, released in 2025. The Splunk documentation describes Event iQ as a system that “learns from your actual data, finding patterns and ranking fields by importance” and proposes correlations the operations team did not configure. Event iQ is most effective when applied after manual NEAP and source tuning work is in place. Deploying Event iQ over a fully untuned environment produces AI-augmented noise rather than AI-reduced noise. For deeper context, see Splunk’s 2025 AI/ML enhancements.
Common failure modes and how to avoid them
Five failure modes account for most underperforming ITSI deployments.
Over-decomposition. The service catalog grows past 200 services, each with limited business meaning. Operators lose track of which service to look at. Avoid by enforcing service-level granularity in Phase 1 and applying a “three-level hierarchy maximum” rule.
KPI inflation. Each service ends up with 15 to 20 KPIs because every metric is “important.” Service Health Score becomes noisy and operators ignore it. Avoid by capping KPIs at 7 to 9 per service and forcing a written rationale for each KPI in Phase 2.
Static thresholds on cyclical KPIs. Morning load spikes fire alerts every workday at 9 AM. Avoid by applying adaptive thresholding to KPIs with documented cyclical patterns in Phase 2.
Underinvestment in NEAPs. Episodes never form, so operators are still triaging raw notable events. Avoid by treating Phase 4 as a 4 to 6 week phase, not a 1 to 2 week phase.
No ongoing tuning. The deployment drifts. Avoid by booking monthly tuning time from the operations team and reviewing the four cadences in Phase 6.
For a broader view of the partner-selection lens for ITSI engagements, see the 2026 Splunk Professional Services Partner USA guide.
Frequently Asked Questions