
Summarize the Content of the Blog





Key takeaways
ITSI answers a different question than monitoring. Monitoring asks "is this server up?" ITSI asks "is the payments service healthy, and if not, which of its 40 components is the cause?"
Configured well, ITSI can reduce alert noise by more than 90%, because it aggregates thousands of raw alerts into a small number of service-level episodes.
ITSI uses machine learning for adaptive thresholding, which recalculates KPI thresholds nightly so normal daily and weekly patterns do not trigger false alerts.
ITSI is not a starter tool. It rewards organizations that already have data in Splunk and a real alert-fatigue problem. Deploying it too early adds complexity without payback.
The buying decision is about readiness, not features. The question is whether your data, your services, and your team are ready to model service health, not whether ITSI can technically do it.
1. What IT operations analytics actually means
IT operations analytics is the practice of turning operational data, metrics, logs, and events, into decisions about service health. The distinction that matters is between monitoring and analytics.
Monitoring tells you the state of components. CPU is at 90%. This disk is full. That service returned a 500. Useful, and also overwhelming, because a large environment produces thousands of these signals an hour and most of them do not matter on their own.
IT operations analytics sits a layer above. It asks: given all those component signals, is the business service healthy? And if it is degrading, which components are driving it, and in what order should someone act? That shift, from "what is the state of every part" to "what is the health of the thing my business actually cares about," is the entire point.
Splunk ITSI is Splunk's IT operations analytics product. It is how you get from a firehose of component alerts to a short, ranked list of service problems a human can act on.
2. What Splunk ITSI does, in plain terms
ITSI takes data you are probably already sending to Splunk and organizes it around services rather than servers.
You define a service, say "online checkout." You tell ITSI which metrics indicate that service's health, its KPIs: response time, error rate, transaction volume, queue depth. You tell it which infrastructure entities make up that service: the load balancers, app servers, databases, and message queues involved. ITSI then continuously computes a Service Health Score, a single number that reflects whether checkout is healthy, and it aggregates the noise from all those components into a small number of episodes, grouped incidents that represent an actual problem rather than a single symptom.
The result an operator sees is not 400 alerts. It is "checkout is degraded, health score 42, driven by database latency, three related episodes." That is the difference ITSI is bought for.
The mechanics of building this, service decomposition, KPI design, entity association, and the six implementation phases, are covered in depth in The Complete Guide to Splunk ITSI Implementation. This guide stays at the buyer's level: what it does, who it fits, and what it costs.
3. The four building blocks: services, KPIs, entities, episodes
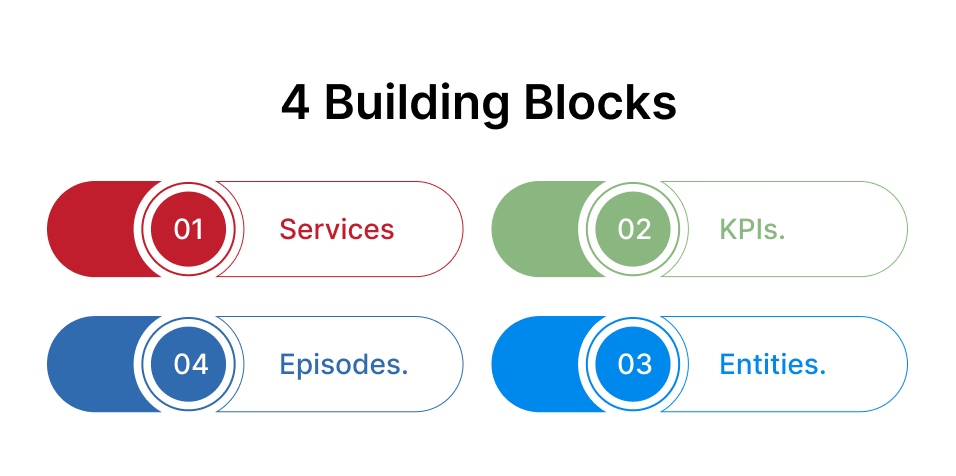
Four concepts carry the whole product. Understanding them is enough to make a buying decision.
Services. A service is the thing your business cares about: checkout, trading, patient records, order fulfillment. ITSI models these as a tree, so a top-level service can depend on sub-services. This is what lets a single degraded database roll up into "checkout is at risk."
KPIs. A KPI is a measurable indicator of a service's health. Response time, error rate, throughput. Each KPI has thresholds that define what healthy, degraded, and critical look like. Getting KPIs right is the hardest and most valuable part of ITSI, because a service is only as meaningful as the KPIs you chose to represent it.
Entities. Entities are the actual infrastructure, hosts, containers, network devices, that produce the data behind the KPIs. ITSI associates entities to services so it can attribute a service problem to a specific component.
Episodes. An episode is a group of related notable events treated as one incident. Instead of paging an operator forty times for forty symptoms of one root cause, ITSI groups them into a single episode with a lifecycle. This is where the alert-noise reduction comes from.
If you understand those four, you understand what you are buying. Everything else is configuration.
4. How ITSI reduces alert noise by more than 90%
This is the number that justifies most ITSI purchases, so it is worth being precise about how it happens rather than treating it as magic.
Raw monitoring generates an alert per breached threshold per component. A single database problem can trigger dozens: connection pool alerts, latency alerts, dependent-service timeout alerts, and every downstream symptom. Traditional alerting treats each as a separate page.
ITSI collapses this in two ways. First, it aggregates related notable events into episodes using Notable Event Aggregation Policies, so forty symptoms of one problem become one episode. Second, it scores at the service level, so an operator watches a handful of Service Health Scores instead of thousands of component thresholds.
Configured well, this reduces alert noise by more than 90%. The phrasing matters: "more than 90%" is what a well-modeled ITSI deployment achieves, and the qualifier "configured well" is doing real work. ITSI configured badly does the opposite. It adds a second alerting system on top of the one you already could not keep up with. The reduction is a property of good service modeling, not of installing the product.
5. Where machine learning fits, and where it doesn't
ITSI uses machine learning in specific, bounded places. It is worth knowing exactly where, because "AI-powered" gets oversold.
Adaptive thresholding. Instead of a fixed threshold, ITSI can calculate thresholds using machine learning that adjust to your data's historical patterns. Splunk's documentation is precise here: adaptive thresholding uses machine learning techniques to analyze data and automatically adjust threshold values based on historical data and current conditions, and it supports standard deviation, quantile, range-based, and percentage methods [1]. The thresholds recalculate nightly so that normal changes in KPI behavior do not trigger false alerts . The practical value: a KPI that is normally high on Monday mornings does not page anyone just for being high on a Monday morning.
Anomaly detection. ITSI can detect when a KPI departs from its own historical behavior and generate a notable event, at both the service (trending) level and across groups of similar entities (cohesion). This catches problems that no fixed threshold would, because the KPI is abnormal relative to itself rather than relative to a number someone guessed.
Where ML does not help: it cannot decide which services matter, which KPIs represent them, or how your business defines a healthy checkout. Those are modeling decisions, and they are where an ITSI engagement succeeds or fails. A useful rule for buyers: adaptive thresholds need at least seven days of historical data or an established pattern to produce recommendations [1], and they work only on KPIs with a real baseline. Point ML at random data and it learns randomness.
For a fuller picture of where AI genuinely adds value across Splunk, and where it is marketing, see AI for Splunk in 2026: Real ROI Use Cases.
6. Who ITSI is for, and who it is not for
Being honest about fit is more useful than selling. ITSI is a strong fit and a poor fit for clearly different situations.
ITSI fits when:
- You run business services with real consequences when they degrade, and multiple teams need one shared view of service health.
- Your alert volume has outgrown your team. Operators are drowning in component alerts and cannot see the service for the symptoms.
- Root-cause analysis is slow because nobody can quickly see which component is driving a service problem.
- You already have the underlying data in Splunk. ITSI analyzes data Splunk already has. It is not a data collection tool.
ITSI is a poor fit when:
- You are early in your Splunk journey and still onboarding basic data. ITSI on top of thin data models thin services.
- Your problem is really dashboards, not analytics. If you need better executive visuals, that is glass table design, covered in Design Splunk ITSI Glass Tables Executives Use, not a reason to buy ITSI you do not have.
- You do not have anyone who can define what a healthy service looks like. ITSI models your understanding of your services. If that understanding does not exist yet, ITSI cannot manufacture it.
The most common mistake is buying ITSI to solve an alert-fatigue problem that is actually a detection-tuning problem. If your alerts are noisy because they are badly tuned, tune them first. ITSI aggregates good signals well. It aggregates bad signals into tidy piles of bad signals.
7. What it costs to run
ITSI cost has three parts, and buyers usually price only the first.
Licensing. ITSI is a premium app with its own licensing on top of your Splunk platform license. That is the visible cost.
Data. ITSI analyzes data, and that data is ingested and stored under your platform license. Modeling more services and more KPIs can increase the data you keep. This is the cost that surprises people, and it is why data utilization matters. bitsIO's datasensAI scores data by utilization using its algorithm, produces ROI and cost analysis, and generates 10 to 15 MITRE ATT&CK-aligned use-case recommendations, which helps separate the data that earns its keep from the data that does not. The datasensAI ROI calculator models this.
Operations. ITSI is not set-and-forget. Services change, KPIs drift, thresholds need review, and episodes need tuning. Someone owns this, either your team or a managed provider. Budgeting for the license and forgetting the operations is the most common ITSI planning error, and it is why some deployments decay within a year. Ongoing operation is covered by Splunk managed services.
8. Signs you are ready, and signs you are not
A short readiness test, sharper than a feature list.
You are ready if: you can name your top five business services in a sentence each, you know roughly what data represents each, you have a real alert-volume problem operators complain about, and you have someone who can decide what "healthy" means for a service. That last one is the gate.
You are not ready if: your Splunk data onboarding is still patchy, your services exist only in people's heads and everyone's version differs, or you are hoping ITSI will tell you what your services are. It will not. It models what you already know.
If you are not ready, the highest-value next step is usually not ITSI. It is getting your data and service definitions in order first, often through a Splunk professional services engagement, so that when you do deploy ITSI it models something real.
9. How bitsIO delivers ITSI and IT operations analytics
bitsIO is a four-time Splunk Partner of the Year and a Splunk Elite Partner, with 300+ enterprise clients and 50+ Splunk certifications across the team. For ITSI, the relevant experience is service modeling across many environments, because the modeling, not the tool, is what determines whether ITSI delivers the more-than-90% noise reduction or a second noisy alerting system.
A bitsIO ITSI engagement starts with readiness, using the test in section 8, so a deployment is not sold to an organization that will not get value from it yet. Where the organization is ready, the work follows the phased approach in The Complete Guide to Splunk ITSI Implementation: service decomposition, KPI design, entity association, episode aggregation, and ongoing tuning. Where a cost or data question is in scope, datasensAI scores data by utilization, produces ROI and cost analysis, and generates 10 to 15 MITRE ATT&CK-aligned use-case recommendations.
Proof worth reading rather than taking on trust: a global pizza chain's proactive issue detection with Splunk ITSI. bitsIO's ITSI work sits within its broader Splunk ITSI practice.
10. Frequently asked questions