Summarize the Content of the Blog


Key Takeaways
Splunk Observability Cloud delivers complete visibility across cloud-native architectures through OpenTelemetry-native platform and NoSample™ tracing
AI-powered agents automate detection, troubleshooting, and remediation, transforming reactive monitoring into proactive incident prevention
Purpose-built Kubernetes capabilities dramatically improve troubleshooting speed in containerized environments
Unified metrics, traces, and petabyte-scale logs eliminate tool sprawl and reduce mean time to resolution
Flexible deployment options and open standards protect investments while avoiding vendor lock-in
Introduction: The Cloud-Native Complexity Challenge
Cloud-native architectures—microservices, containers, serverless functions, and distributed systems—enable unprecedented agility. But they’ve also introduced complexity that traditional monitoring tools weren’t designed to handle.
When customers report slow checkout times, where do you start? The issue could originate from dozens of microservices, span multiple clouds, involve ephemeral containers that no longer exist, or stem from a database query buried deep in your stack. Traditional monitoring gives you fragmented data across multiple tools, forcing you to piece together puzzles manually while burning hours in war rooms.
This is why comprehensive observability has become a strategic imperative in 2026. Splunk Observability Cloud addresses this challenge as a full-stack, OpenTelemetry-native platform built specifically for modern cloud-native applications. It provides the unified visibility, intelligent insights, and rapid troubleshooting capabilities that distributed architectures demand.
What Makes Splunk Observability Cloud Different
Complete Data Capture with NoSample™ Tracing
Many observability platforms rely on sampling—capturing only a percentage of traces to manage costs. The problem? That missing 95% or 99% might contain the exact transaction explaining your production incident. When troubleshooting issues affecting a small percentage of users, sampling-based approaches leave you blind.
Splunk takes a different approach. NoSample™ tracing captures and analyzes 100% of traces in real-time. Every transaction. Every request. This complete visibility eliminates blind spots and ensures you never miss critical data needed to resolve issues quickly. When troubleshooting Kubernetes applications where pods constantly spin up and down, this comprehensive data capture becomes crucial.
OpenTelemetry-Native Architecture
Vendor lock-in represents one of the biggest risks in observability investments. Proprietary agents create dependencies that make platform changes costly and time-consuming.
Splunk Observability Cloud cloud-native monitoring is OpenTelemetry-native, built on the industry-standard open-source framework. You instrument applications once using open standards, and that instrumentation works across platforms. As one of the top contributors to the OpenTelemetry project, Splunk continues advancing the standard, including the new OpenTelemetry Injector (Alpha) enabling zero-code instrumentation for Linux hosts and traditional VM environments.
Unified Observability Across the Entire Stack
Cloud-native applications depend on infrastructure, databases, networks, APIs, and increasingly, AI models. Fragmenting observability across multiple tools creates silos that slow troubleshooting.
Splunk Observability Cloud unifies three essential capabilities:
- Splunk APM cloud-native monitoring provides deep application visibility with distributed tracing and code-level insights
- Splunk Infrastructure Monitoring delivers real-time visibility across hybrid cloud and edge environments with 300+ integrations
- Splunk Real User Monitoring captures actual user experiences, connecting technical metrics to business outcomes
The platform automatically correlates petabyte-scale log analytics with real-time metrics and traces, giving you complete context in one place—no tool-jumping required.
Kubernetes: Purpose-Built for Cloud-Native Troubleshooting
How does Splunk Observability improve troubleshooting in Kubernetes? The platform provides purpose-built capabilities designed specifically for containerized applications.
The Kubernetes Navigator offers intuitive visibility across clusters, namespaces, workloads, and pods with real-time event and log correlation. Splunk Observability 2026 introduces a completely redesigned Kubernetes monitoring experience (Alpha) with enhanced data discoverability, advanced filtering, and support for all status and conditions across nodes, pods, and containers.
Machine learning-powered Autodetect capabilities automatically identify anomalies without manual threshold configuration. When clusters experience unusual CPU spikes or memory pressure, Autodetect surfaces issues proactively, often before impacting applications.
For hybrid environments, the new Kubernetes deep linking feature (Alpha) creates seamless connections between AppDynamics application issues and underlying Splunk Observability Cloud infrastructure, dramatically reducing resolution times.
What Are the Latest Features in Splunk Observability Cloud 2026?
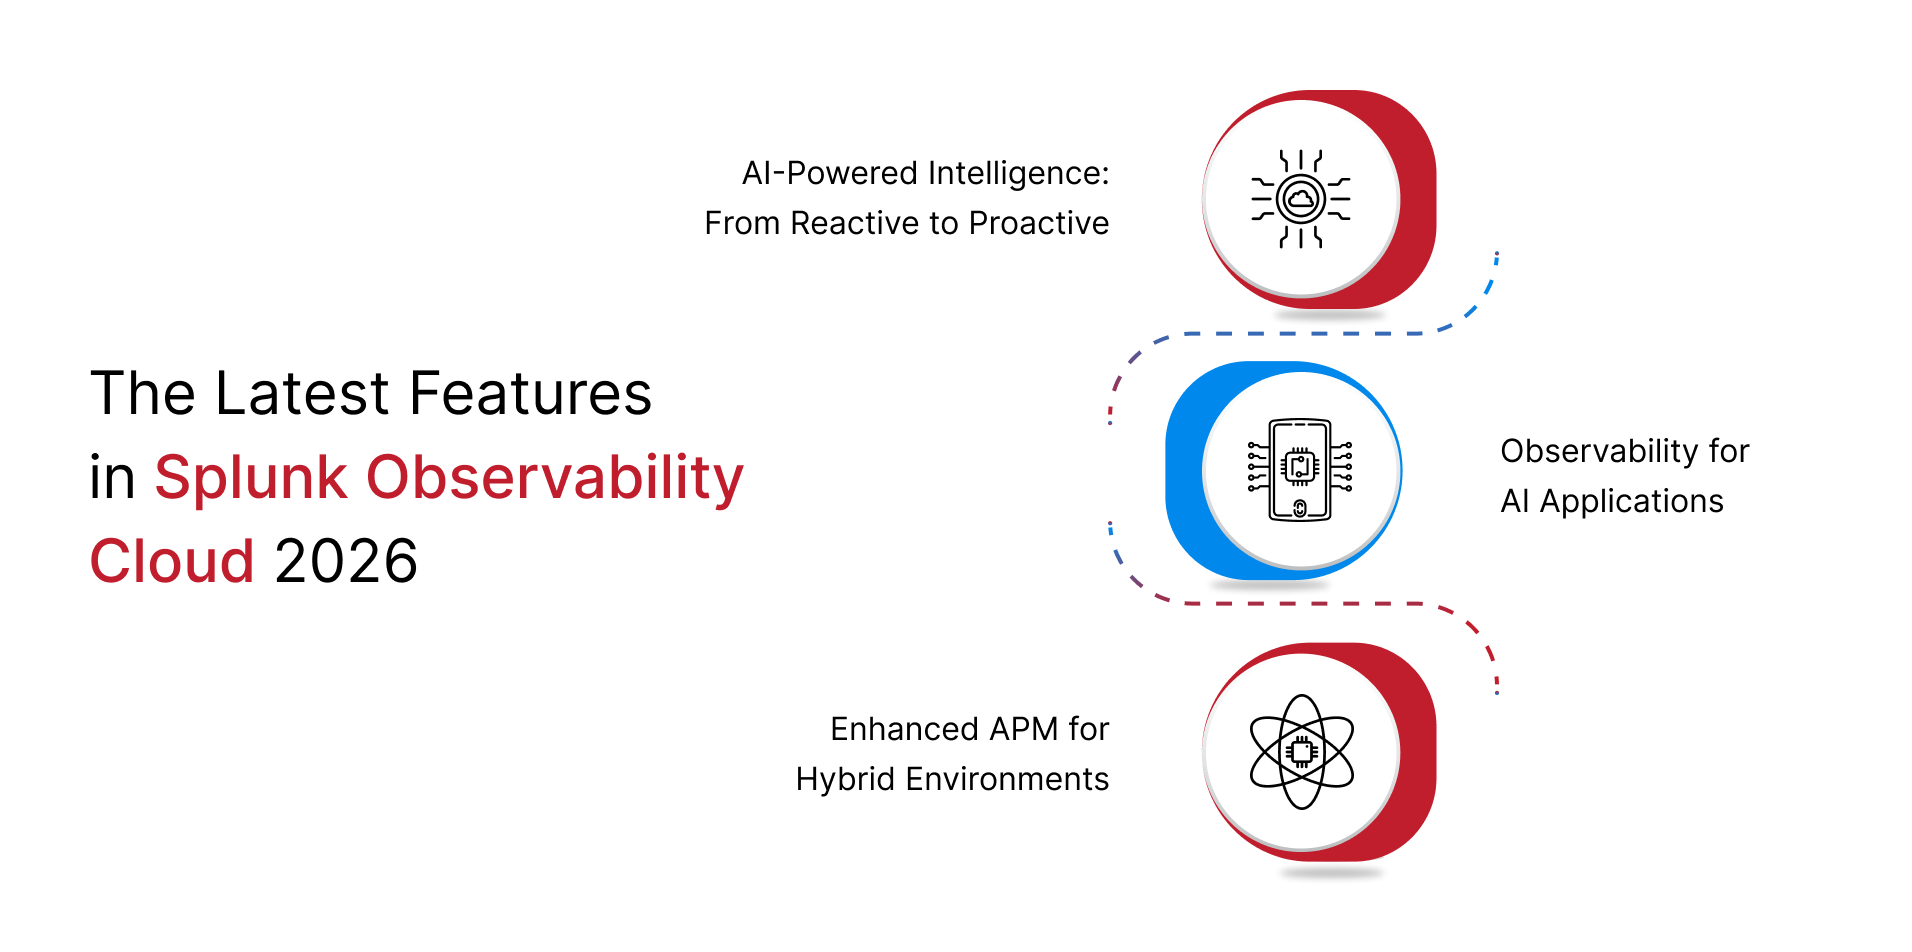
AI-Powered Intelligence: From Reactive to Proactive
The most transformative advancement is agentic AI throughout the platform. AI Troubleshooting Agents (Alpha in Observability Cloud, GA in AppDynamics) act like virtual SREs, automatically analyzing service and infrastructure data when incidents occur. Instead of hours manually correlating data, teams receive AI-generated insights identifying root causes with actionable recommendations in plain language.
These AI-powered insights from Splunk Observability analyze recent deployments, Kubernetes events, and historical incidents to identify patterns human operators might miss. AI Remediation Agents (Alpha) take automation further by automatically executing remediation actions for common Kubernetes pod issues, moving toward self-healing infrastructure.
The Episode Summarization capability in ITSI uses advanced AI to generate comprehensive incident summaries—what happened, when, contributing factors, root cause analysis, and next steps—all in a single view instead of clicking through multiple tabs.
Observability for AI Applications
As organizations deploy AI-powered applications, new observability challenges emerge. Splunk’s 2026 releases introduce AI Infrastructure Monitoring (GA) and AI Agent Monitoring (Alpha in Observability Cloud, GA in AppDynamics). Teams can track health, performance, security, and cost of their entire AI stack, including Nvidia NIMs, vector databases like Milvus and Pinecone, and cloud AI platforms.
Monitoring extends to AI quality metrics like hallucination rates, response relevance, and accuracy. Integration with Cisco AI Defense provides visibility into security risks including prompt injection and data leakage.
Enhanced APM for Hybrid Environments
Recent enhancements include Business Transactions monitoring for complex workflows, Call Graphs for code-level insights, and Service Map Grouping for visual service organization. The Combined AppDynamics Agent (GA) offers a pragmatic migration path with a single agent containing both AppDynamics and OpenTelemetry code.
The new Database Monitoring (GA) provides specialized visibility into database performance, identifying slow queries and offering AI-powered optimization recommendations for Microsoft SQL Server and Oracle Database.
Splunk vs Datadog for Observability in Multi-Cloud
When evaluating platforms, organizations frequently compare Splunk Observability Cloud and Datadog. Key differentiators include:
- Deployment Flexibility: Splunk offers on-premises, cloud, hybrid, and virtual appliance options versus Datadog’s SaaS-only approach—critical for regulatory compliance and data sovereignty requirements.
- Open Standards: Splunk’s OpenTelemetry-native architecture ensures you own instrumentation versus Datadog’s proprietary agents that create vendor lock-in.
- Complete Data Capture: Splunk’s NoSample™ tracing captures 100% of traces versus Datadog’s sampling—crucial for troubleshooting intermittent issues.
- Log Analytics at Scale: Splunk’s heritage provides unmatched capability for petabyte-scale log correlation with real-time metrics and traces.
- Cost Control: Splunk’s granular data aggregation, filtering, and transformation capabilities enable organizations to keep all metrics while only paying for what they need.
Real-World Impact
Organizations implementing Splunk Observability Cloud report transformative outcomes:
- Dramatically Reduced MTTR: Teams resolve issues in minutes rather than hours by unifying data with AI-powered guidance
- Improved Reliability: Proactive anomaly detection enables addressing issues before customer impact
- Enhanced Productivity: Junior engineers troubleshoot effectively with AI-guided investigation
- Business-Aligned Prioritization: Technical metrics correlate with business context for impact-based prioritization
- Cost Optimization: Complete visibility enables identifying waste and optimizing resource allocation
Why Partner with bitsIO
As a 4x Splunk Partner of the Year, bitsIO brings unparalleled expertise in Splunk Observability Cloud deployments. We deliver comprehensive support across architecture design, implementation excellence, and ongoing optimization for cloud-native, hybrid, and multi-cloud environments.
Our clients highlight the value we deliver:
Conclusion: Observability as Strategic Advantage
Cloud-native applications drive digital business, but their complexity demands comprehensive visibility, intelligent insights, and rapid troubleshooting that match modern application delivery pace.
Splunk Observability Cloud delivers through its OpenTelemetry-native architecture, NoSample™ tracing, AI-powered troubleshooting, and unified platform. Specialized capabilities for Kubernetes, AI applications, and hybrid architectures make it uniquely suited for today’s diverse infrastructure landscapes.
As we move through 2026, the gap widens between organizations with effective observability and those struggling with fragmented monitoring. Comprehensive observability isn’t just about faster troubleshooting—it’s about delivering better customer experiences, enabling innovation, and building digital resilience.
Take the Next Step
Ready to experience the power of Splunk Observability Cloud for your cloud-native applications? Contact bitsIO today to schedule a consultation and discover how we can help you achieve comprehensive visibility, faster troubleshooting, and operational excellence.
Explore bitsIO’s Splunk Observability Cloud Services →