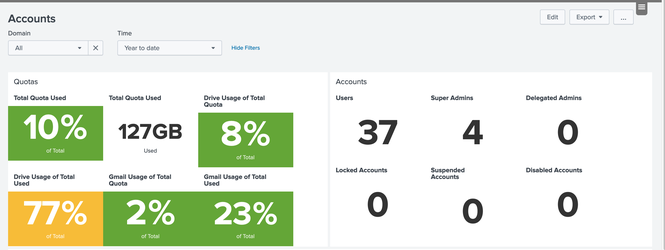
Splunk dashboards deliver visualizations that turn data into doing. Effective dashboards support a use case and contain panels which provide specific views of the data in the use case workflow. To illustrate, Figure 1 is a dashboard designed to provide insights into an organizations GSuite account usage. The panels in the Accounts dashboard are powered by searches, which fire when the dashboard is loaded or refreshed. Code Listing 1 displays the SPL for panels “Total Quota Used (% of Total)”, “Total Quota Used (GB Used)”, “Drive Usage of Total Quota (% of Total)”. These searches run concurrently along with the searches which power the other dashboard panels. As a result, there can be overhead for search system resources resulting in sluggish dashboard performance.
 The base search, shown in Figure 3, is defined by:
 The base search query shown in Figure 3, corresponds to the common portions of the SPL in Code Listing 1.
The post process searches, shown in Figure 4, are defined by:
The base search query shown in Figure 3, corresponds to the common portions of the SPL in Code Listing 1.
The post process searches, shown in Figure 4, are defined by:
 In this post I have described how dashboard performance can be greatly improved by lowering the overhead on search resources with techniques presented above. A well designed dashboard with many panels can be designed to run significantly fewer searches with the use of base searches, post process searches, and best practice SPL optimization. I hope this post will help you improve the performance of your dashboards.
Happy Splunking!
In this post I have described how dashboard performance can be greatly improved by lowering the overhead on search resources with techniques presented above. A well designed dashboard with many panels can be designed to run significantly fewer searches with the use of base searches, post process searches, and best practice SPL optimization. I hope this post will help you improve the performance of your dashboards.
Happy Splunking!
Figure 1 – Accounts Dashboard in GSuite for Splunk App
Code Listing 1 – Panel Search Queries
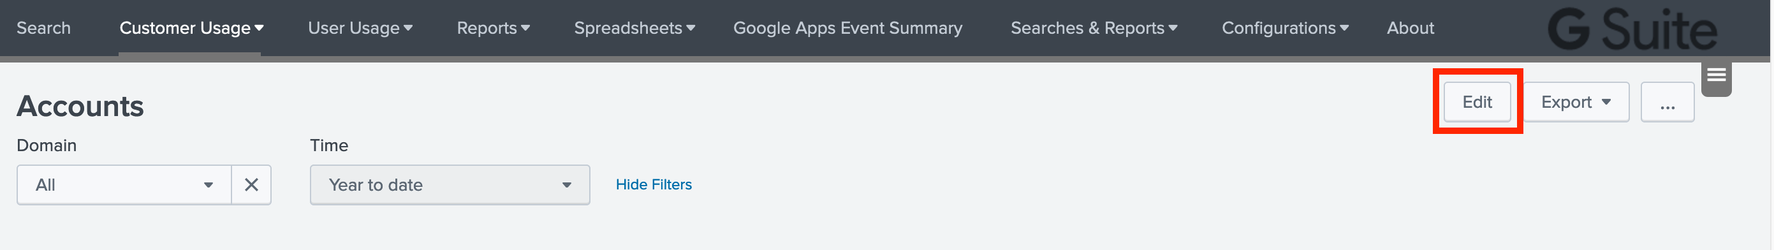
# Total Quota Used `gapps_accounts_usage(“*”)` | stats latest(param_*) as * by domain | eval f = round( (accounts_used_quota_in_mb / accounts_total_quota_in_mb * 100),2) | stats sum(f) # Total Quota Used `gapps_accounts_usage(“*”)` | stats latest(param_*) as * by domain | eval f = round( (accounts_used_quota_in_mb / 1024 ),2) | stats sum(f) # Drive Usage of Total Quota `gapps_accounts_usage(“*”)` | stats latest(param_*) as * by domain | eval f = round( (accounts_drive_used_quota_in_mb / accounts_total_quota_in_mb * 100),2) | stats sum(f) Dashboard performance can be optimized by utilizing a base search defined in the dashboard SimpleXML. The base search results is passed to any number of post process searches which greatly reduce the load on search resources. A base search should be a transforming search that returns results formatted as a statistics table. To view the base search optimization implemented in the Accounts dashboard, select “Edit” and then select “Source” as in Figure 2.Figure 2: Edit Accounts Dashboard
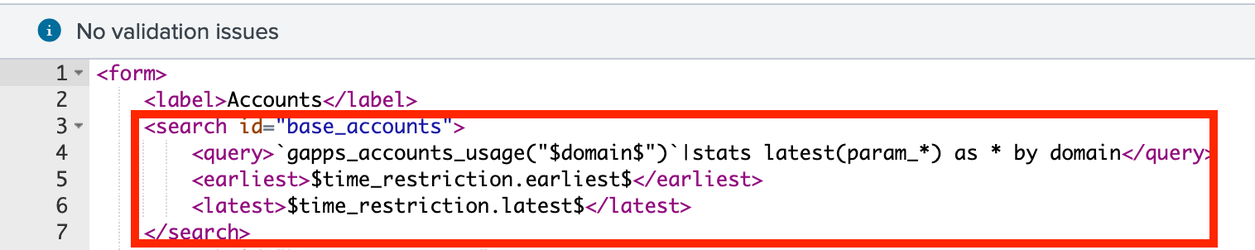
The base search, shown in Figure 3, is defined by:
- A <search> tag,
- An “id” attribute of the search tag which is the handle used to call the base search,
- A child <query> tag where the base search query is defined.
Figure 3 Base Search Definition
The base search query shown in Figure 3, corresponds to the common portions of the SPL in Code Listing 1.
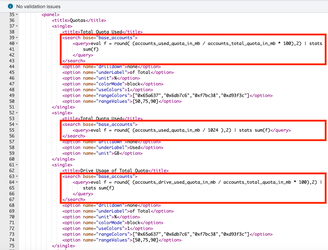
The post process searches, shown in Figure 4, are defined by:
- A <search> tag,
- An “base” attribute of the search tag which calls the base search,
- A child <query> tag where the post process search query is defined.
In this post I have described how dashboard performance can be greatly improved by lowering the overhead on search resources with techniques presented above. A well designed dashboard with many panels can be designed to run significantly fewer searches with the use of base searches, post process searches, and best practice SPL optimization. I hope this post will help you improve the performance of your dashboards.
Happy Splunking!